Monday, April 25, 2011

Stock play of the week


One small cap idea to go long for this week is HDY.

Right now its trading at 4.41 and looks like 4$ was the floor and base on this one , technicals looks very bullish to me and I think there is a great upside potential in this stock for a swing play as it is trading in a bullish triangle pattern with resistance right below 7$. This may see 7+ on breakout soon which could be a nice double over some time. I also like HDY fundamentals , so right now seems like a good place to go. This is one of my good plays this week - the upside % gains is good and above 50% for a swing and near a double bagger if we break above 7+

Also watch closely oil plays as oil is going to new highs early this week as called last week and you can play ROYL , TGC , LEI those small oil babies should pick up.

For now every week I will give out one play of the week on the long side for a potential swing play. For this week the best potential play is HDY swing play. Remember to stop out below support at 4$

Overall I believe that silver topped today at 50$ and think its a amazing opportunity to get short silver for the longer run. I think 50$ in silver is a psychology barrier and a blow out top just made today. You can short silver via ETF's.


Have a nice day and follow me on twitter to get live updates.

Friday, April 22, 2011

Market view


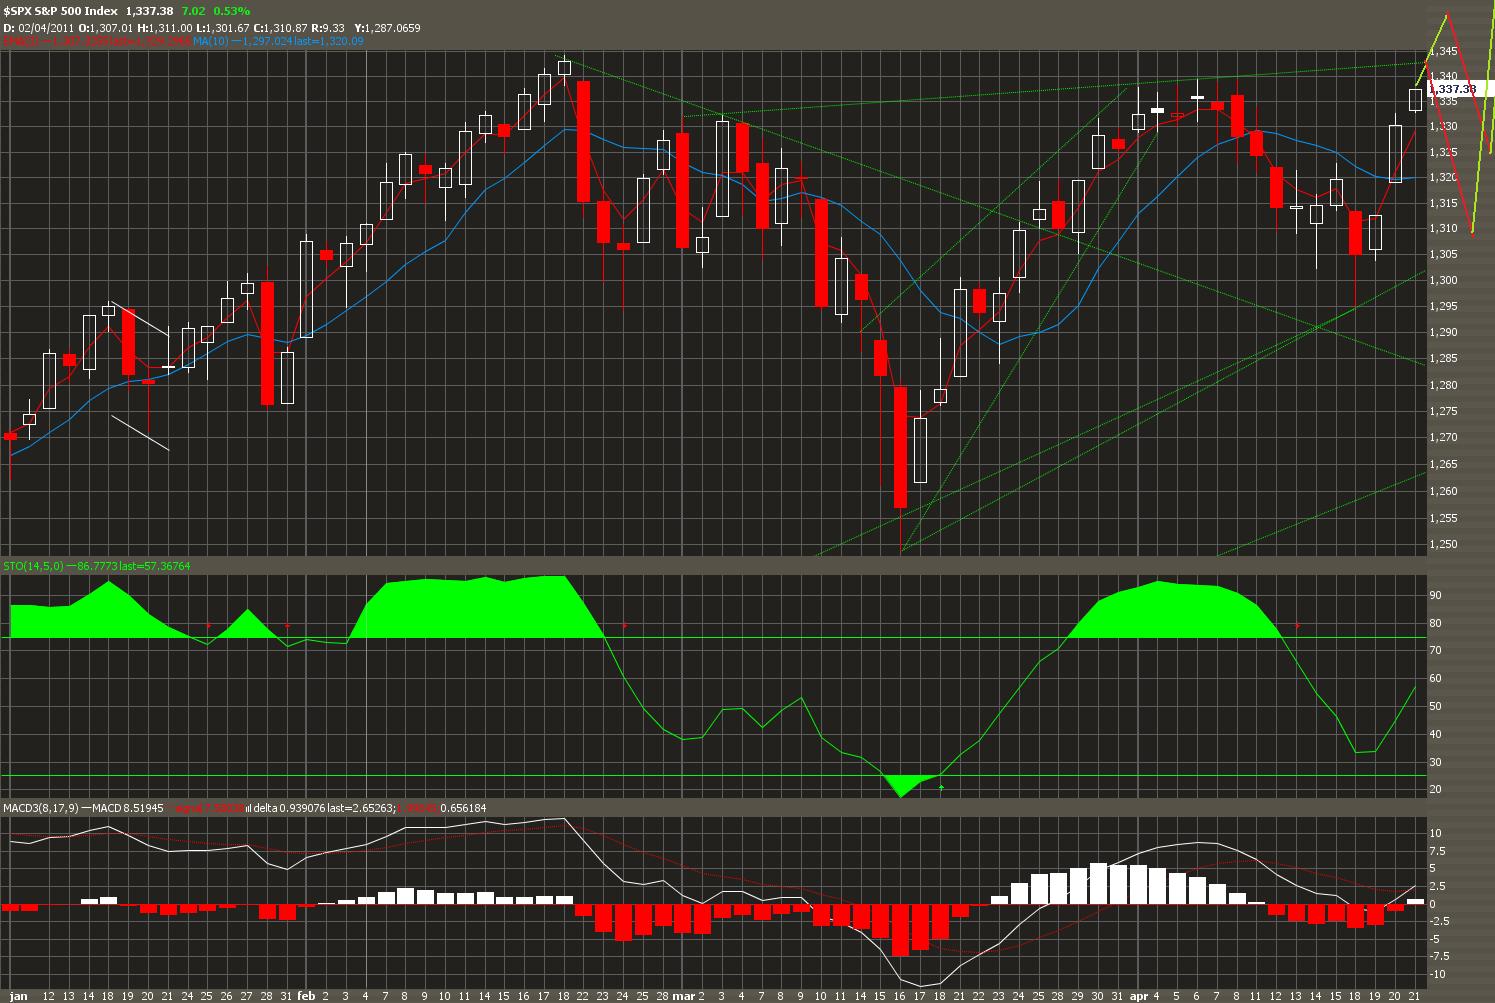
Markets kept holding strong on Thuersday before a longer weekend than usual. I still remain long SPX since 1295 and 1305 area where I got long and up with nice profits, I have taken profits but still holding other long positions. My outlook havent changed yet - the inverse HS pattern if playing out will have us to go a lot higher, but I really question a rally higher from here as we are EXTREME overbought at the short term now.

So what I think at the moment is a possible gap up on Monday to make the new highs above 1344+ which I have been calling for and then possible hit 1350 mark. If we see new highs on Monday I am going to take profits and move into shorts (Just for the short term) as I think we at least will just have 1 or 2 days pullback as the VIX is below the lower BB and when VIX moves above in the bollinger bands again that will give a sell signal in markets. I expect that to happend sometimes next week. I am also watching a trendline and we could be trading in a kind of triangle pattern with upper trendline at 1344 at the moment (recent highs) so there is lots of questions.

But for overall I expect a last pop up before a pullback, so if we gap up monday I am thinking about taking the profits and move slowly into some shorts. (Just for a pullback)

The VIX made a red hollow candlestick which usually marks a bottom - so a good possibility that VIX wont go lower here - but again , we might even see VIX near 12-13 if markets keeps rally up now.


I still think oil will see near 140 a barrel before topping this year and then a good move down again to below 100 a barrel later this year.

Oil looks ready for new highs early next week imho.

Remember I am extreme bearish markets overall in the longer term and according to fundamentals - but for now short term trend remains up and no signs of a crash move yet in markets.


Have a nice weekend and enjoy

Thursday, April 21, 2011

Market view


Markets had a BIG and nice rally yesterday - and we remain long markets 1295 SPX as the right shoulder in the inverse HS pattern seems like it will be played out.

My objective target is still 1350 area but the inverse HS pattern targets higher.

Actually my first target is 1350 , but then I think we might have a pullback before moving to 1360-1380 area.

So am I bullish now ? Yes , and I have been bullish as long SPX 1294-1295 were holding. Is the fundamentals great ? NO and it still looks very bearish by fundamentals , but the technicals works a lot better than fundamentals and you cant trade on fundamentals. So the short term trend is up and lets see if we cant see new highs soon, we might very well have a little pullback soon as VIX closed below lower BB.

My time zone for the top is around late April/ Early May.

Remember to follow me on twitter where I post daytrades and swing trades.

Have a nice day

Wednesday, April 20, 2011

Market view

Will be a short update today - and yesterday we had a very strong day and I still expect a rally to come with my objective target of 1344+ which means new highs.

Time will tell , we had a bullish MACD histogram bar and looks like we could see a positive MACD histogram soon.

Still long markets since 1305 and 1295 where I added and holding longs, follow me on twitter if you want to know some plays.

Have a nice day

Tuesday, April 19, 2011

Market view


Markets did a good sell off on some credit news of US yesterday - but markets did not sell off heavy as most of the selling pressure were on the gap down.

So did I cover my longs or what ? - No I actually added to my long positions at 1295-1296 level as I saw it holded very well today and now we just have an even BETTER inverse HS pattern than before.

Okay the left shoulders bottom were 1294-1295 and yesterdays bottom were 1295 perfectly. Look at the horizontal line , completley perfect touch , and a very nice rally or bounce after this touch. We made a hammer formation on daily charts on most indexes which is usually bullish. But if we move to below 1290 and lower I will most likely just take my longs of the table - but as I see it right now I think we have a good possibility to take out new highs by early May or end of April....

We will see how markets acts near term , as the short term trend is still down you gotta be careful doing the opposite , but SOMETIMES you need to take risks too to make big money and thats why I bought longs at 1295-1296 or "added" and then have a stop if we move below 1290 or so and watch markets. But until now we may very well have bottomed.

As I stated last week the dollar had HUGE OPEN INTEREST in calls , which is BULLISH.

The dollar is rallying very good with volume , that is the ONLY thing which worries me. FXE did hit my big trendline and stopped and moved down and the US looks like rally - thats not good for markets if the US dollar is rallying. So there is a good possibility I will stop out of my longs , but until then time will tell. This is just how I see it right now and I think it looks like a perfect INVERSE HS pattern.

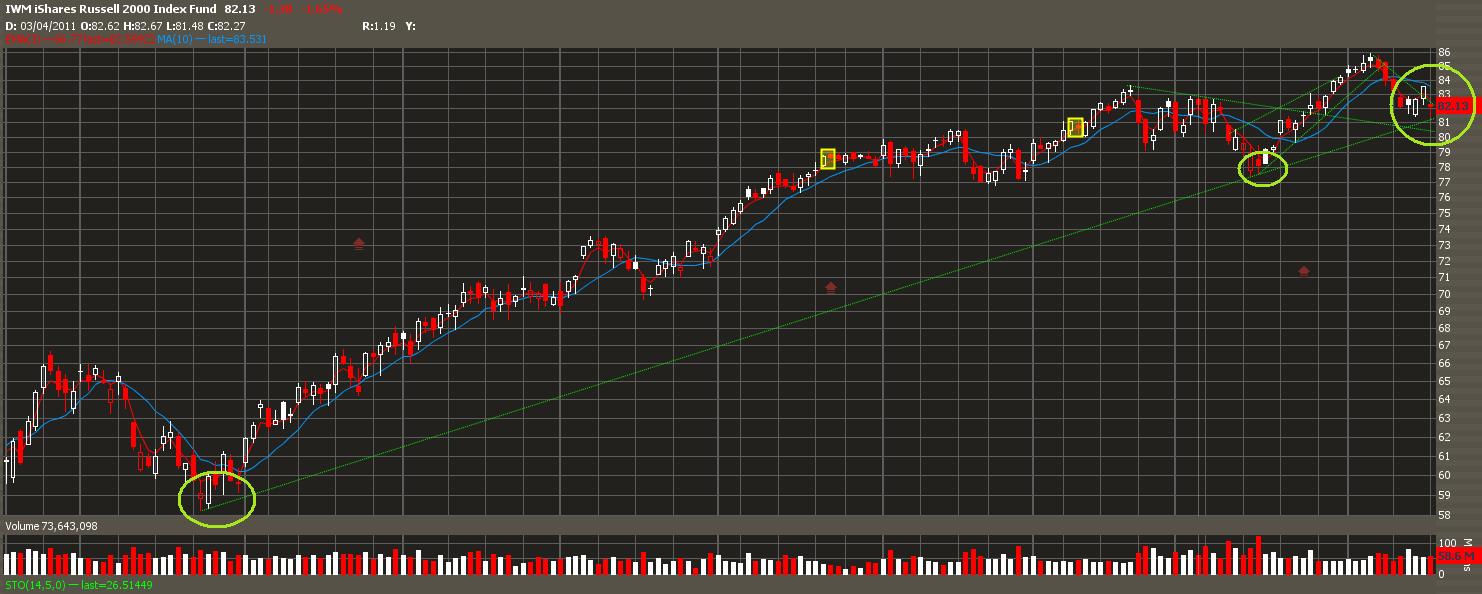
Looking at IWM small caps they are back to the huge support trendline since September lows - if we BREAK BELOW this level , may get ugly , but if we bounce here thats a target for new highs comming, time will tell us near term but watch it...

The target of the pattern IF playing out would be in the 1360-1380 range, lets see whats comming next.

Have a nice day

Monday, April 18, 2011

Market view


Back from weekend in Norway and ready again.

As I stated in the latest blog post , if 1300 on SPX held which it did on Thursday , I got out of my short positions with good profits from 1333-1330 and got long the markets SPX 1305 via some small caps and other positions.

The reason were simply because we did NOT break below 1300 which I watched like a hawk and markets had strength enough to hold above , therefore my previous posts said to cover my shorts and get ready and go long.

For now I think we have some upside left and might see SPX to new highs over next weeks above 1344.

As I see it right now I think we may see 1350 next. The russels got a bullish MACD histogram confirmation on friday which is bullish for now and another sign that we may see higher levels near term.

Overall I am still VERY bearish markets longer term and by fundamentals - but the charts now tells me its better to be long for the short term. So profits taken from 1333-1305 in my shots which were very good and now got long small caps and other longs at 1305. You can follow me on twitter "Sqwii" as I post my trades.

There is a potential inverse HS pattern which may target us near 1360-1380 if playing out , but I dont think we will reach that level in the first run , but time will tell.

My target right now is 1350 by end of April early May and thats how I play it for now.

IF markets is going to reverse and move below 1295 short term I am going to take the loss on long positions , but until then I'm long.

Thursday, April 14, 2011

Market view


Markets did end up quite flat after a sell off for the whole weak , but imo a very weak bounce we got and ended markets nearly flat.

There are 2 possibilities for what I think now as indicated in the charts - if we dont close below 1300 I will most likely take gains of my shorts since 1333 and go long , but if we close below 1300 I am going to hold my shorts.

For now the short term trend is still down and TZA has been a big fat gainer of last few sessions.
There is a potential inverse HS pattern setting up , which is very bullish and thats why I am probably going to take profits if we dont break below 1300...

2 counts on my chart the green and red. Right now the trend still remains down and I have not got any buy signals , so I would continue to short until otherwise.

The critical area in IWM chart is at 80-81ish level , watch this level closely , if we get there , watch if we get a lot of buyers comming in ( then probably bottom ) if not , we may have a fast and big sell off....

Big trendline support from september lows there , note that the small caps has been hit harder than overall markets recently.

I wont be here as I am going to Norway over the weekend , so going early off for weekend - but watch those levels or maybe stay on sidelines.

Will update on Sunday again

Have a nice weekend