Friday, July 29, 2011

Market view


Back from a lovely vacation in Greece and looking at the markets seems like just a quite nasty week from 1340's to below 1300 again. I took a loss on my TNA position which I held (should just have sold them all before vacation , but took the loss today from my 70% position)

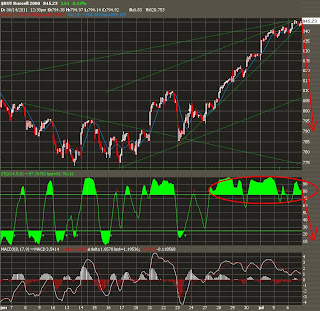
Back to markets - right now we are at a very critical area in markets as SPX just closed above MA(200).

As I have said before - the 3rd time we are going to test MA(200) I dont think will hold - which means , I think we are going to breakdown below the MA(200) near term.

Looking at the dollar (UUP) its on a buy signal and as long the dollar holds above 21 level , it seems to me like the dollar can rally near term and with this - the markets should fall down lower. But if the dollar however reached new lows , then the markets has a very good chance to rally.

I'm trying to ignore as much as I can on all the news with debt ceiling and so on - overall just looking at the charts and see what they are telling me.

VIX is in the critical area where we can have fear and panic and is now overbought on daily chart - which suggest some kind of bottom which could come. But when I look at the monthly chart on VIX it looks very bullish to me which means we might see some more panic ahead than here....

Its hard to predict the exact movement , but I'm quite neutral and leaning to the bearish side over the next weeks as I dont think a bottom is in place. If we break the MA(200) then I see the topping HS pattern playing out with a target in the 1130-1150 area....

I went short silver via ZSL just before the weekend 13.4's and will stop out if we break below the recent lows - I think there is a good chance that silver and gold can start to drop here - if I'm wrong I will stop out...

Remember - no one out there is never 100% right , so if you are wrong , adjust and take a little loss than sitting on a big one later on..

Got a few TZA as a starter on Friday at 37.5 - not much as I'm not overly confident this time , but if we see TZA above 40 next week I bet you its gonna go which means markets going down below MA(200).


Conclusion: I'm leaning to the bearish side now and think we may see a lot more selling over next few weeks - as we closed right above MA(200) I really dont think it will hold , also if we get a debt deal we may have a 1 day spike , but probably a sell the news event as the deal results probably wont be happy faces. Overall staying a bit neutral watching what markets doing next week - got a few starter TZA and short silver.

Have a nice weekend everyone and see you all on Monday !

Thursday, July 21, 2011

Market view


This is my last update before I'm going on vacation to Greece for 1 week - so there wont be any more updates most likely until next Friday - just so you know about this.

Markets did a boring day on Tuesday , quite flat - but after a 1.6% on Monday , markets held up quite strong actually - which is BULLISH action and marked as consolidation before it goes higher.

I think as the bears could not even take us below 1320 - there is a good chance we rally higher soon.....

I'm still holding all my swing position on TNA 79.35 and will continue to do so. Before I head out to vacation I'm going to take a little profits on my TNA position as I dont have the time to look at markets everyday - but I feel pretty confident too that markets have a good chance + window dressings into end of month + more earnings comming up - which could fuel the markets higher.

So all in all - I'm thinking about just holding my TNA swing position (selling some before) but then holding some until I'm back next Friday the 29th July.

You know - IF and only IF TNA is playing out the inverted HS pattern... well then TNA might see above 100 next which I dont really believe right now - but the pattern targets have bee quite accurate in the past and if it plays out again - then we are about to see a major rally next weeks......

We are already up nicely this week and I'm already in good profits - but if this is just the start of a bigger rally - then I should hold all to get most profits.

I'm watching thet trendline on SPX at 1354 area right now as shown on chart - IF we break this line.... then I think we could see new highs actually.....

If we get a pullback today - I would watch 1310-1315 level for buying the dip before we move higher , all imo !

The question is just - if we move to this level already in this week - I bet you that we are going to break it sometimes next week. Markets has been moving very fast up since mid June with a pullback to 1295-1300 , now the question is if we move higher.

Conclusion: Holding my swing position in TNA (selling some before vacation but also holding some - reducing risk). And I'm also going to hold some good looking small caps for a swing trade 1 week.

I hope you enjoy reading my blog - and see you all next Friday where I will be back with updates every day.

Have a nice weekend and good luck trading everyone !

Wednesday, July 20, 2011

Market view


Wow - markets did an AMAZING rally yesterday , breaking the falling wedge / or handle pattern on my screen and moved up all day long to 1.5-2% on the way. Wow as I told people at 1295-1300 that was the buy spot to go long - and then we got a rally in just 1 single day to 1320-1330.

Overall markets is very overbought on the short term timeframe 30min and 60min - but it looks like another "kick off" start for a good rally up for next weeks - honestly I did not believe we would move this high already - if we keep going like this we will take out new highs and a target would be 1380-1400 area on SPX.....

Overall small caps TNA /IWM /RUT could be seen as a inverted HS pattern - if this is a true pattern then we had the right shoulder in - and a big rally with upside target to 111$ in TNA if we break the neckline at around 89$ would come true... thats a HUGE upside move. Honestly I dont think we will move to new highs , my SPX target is still 1345 but again - I wont rule out that new highs is possible :-)

I'm long and strong with a size position in TNA 79.35$ and already good in the money as it closed 83.5$.

Conclusion:
Short term charts tell me we could expect a pullback soon to 1310-1315 area before we move higher. Overall holding all 3x long ETF TNA from 79.35 as I think markets is going higher next weeks - I would buy the dips we get.

I wanna tell everyone now - that I am going on 1 week vacation to the bankrupt country of Greece by Friday - this means I wont be able to update any kind of charts over the weekend and the next week, so you gotta live without any updates for 1 whole week ( I'm sorry :/). Just so you are informed if I dont make updates.

Have a nice day

Tuesday, July 19, 2011

Market view


Markets did a move down to 1295-1300 level exactly my first target to the downside 1 week ago - when we were trading at near 1350.

I really was not sure if we would meet 1295-1300 on Friday last week as we just might move up from there , but we did and tested the area which I think is a short term bottom.

Markets ended with a red hammer bottom reversal candle yesterday on indexes , which favours that the bottom is in.

I believe you should buy this dip - as long 1295 holds it should be an excellent buy..... all IMO.

I see it as a kind og "cup and handle" pattern - where we have made the handle over the last weeks down to support shown on chart.

If this is true we are about to see a nice rally - actually above the recent highs in 1350's , but my first target to the upside is 1345 though.

Just looking at small caps TNA / IWM / RUT - it might also be indicated as a right sholder formed in an inverted HS pattern - but who knows , not sure if it plays out - I dont think so - but if true upside is above 1400 on SPX......

I bought a big size position in TNA yesterday at 79.35 and holding for a swing play - I think it will do very over next weeks from here.

Sentiment right now felt very bearish yesterday as we moved below 1300 - seemed like no on really dared to buy - but lets see what happends from here.

I would expect a breakout of the fallign wedge down lately , then a retest of the trendline break and then a move higher possible end of this week or next week.

Conclusion:

I think you should buy the dips - then as long 1295 holds should be fine on SPX imo - I think we will see a rally from this level to 1345 my first upside target.

In size with TNA this time 79.35 - lets see how it plays out

Have a nice day

Monday, July 18, 2011

Intraday update


We are right now about to backtest the horizontal resistance which we broke out of in this area 1295-1300 area - you remember the recent big rally we had ? Now we dropped down to this level which should act as support before next rally up......stay tuned

Remember as I've told lots of people 1 week ago , 1295-1300 was first target and we are right here in this area now.... time to load up IMO

Loaded TNA today a big size position for swing 79.35$.... holding all

Saturday, July 16, 2011

Market view


Markets did a gap up on Friday and were moving sideways and choppy up and down , seems like its consolidating to me before a bigger move to come....

The thing is which I have indicated 1 week ago , that I was expecting a short term bottom to be in late this week (thursday/friday) , I still stand by my call and I think we may have seen the short term bottom right above 1300 ( remember 1300 were my first target - if this was holding we should move up , if it was not holding - we should go down hard..)

I dont think markets is ready yet to fall down hard - seems like we are going to get another push higher near term. So I rest of my shorts of the table in TZA , just in small profits nothing big - and went into TNA for a starter swing trade at 81.5$ on Friday. I think I'm going to add if we gap down next week to 1295-1300 level , as long this level holds , longs should be fine imho.

Again - I might be too early on my call for a bottom in markets - as I have NOT got any buy signals yet in markets.... If markets green monday I will most likely get those buy signals - but I cant say right now that I got buy signals on daily charts..

I just see a very potential backtest of the broken trendline we had on the big rally in June , then pullback to backtest it over the lsat weeks from 1350 -> 1300 level and then possible new rally to come above 1350 again ? I'm frankly not quite sure how high we go right now , if its only a rally to 1330 or we move up to around recent highs 1370's....

But I think its better to buy the dip right now if we get some near term at 1295-1300 for a short term rally. Next week I could expect some choppiness up and down - but I would give it an upside bias , also that I bought TNA.

I am short silver via ZSL - and hoping for a short term top in silver soon (as fear moves away....)

Again - no one makes 100% accurate calls out there but at least I try to post my trades and oppinion where this markets is going. If I get a buy signal in markets sometimes next week I will add to my long swing positions.

Have a nice weekend and enjoy !

Friday, July 15, 2011

Market view


Markets had a little rally first on the day , but then started to plunge all day long into close and closed down -0.7% and small caps some more. VIX increased above 20 and moved into the 20-30 zone where the fear is comming in.

I took TZA off the table on my swing trade yesterday as I saw that the markets could have a potential bottom in place very soon ( short term bottom ) - however I have NOT got any kind of SELL signal on my short ETF , they are all still on buy and I have still sell signal on indexes.

On my charts I showed you that markets did come back to a potential "backtest" of broken downtrendline , which is a "bullish" signal - and SPY also made a possible inverted HS pattern , which targets much higher from here - actually above 1400.

As I said before this week - I've had a "bottom cycle" date late this week (Thursday/Friday) so either way I think we are close to a short term bottom - why I think its good to take some profits off on shorts. But last time I were a bit too fast taking profits on TNA - now I am waiting for a SELL signal on my last position in TZA(holding 50% position).

My plan is now - when I get a sell signal on TZA I will jump in TNA for a swing position (as this one will give a buy signal then) but I will make an update on twitter if so.

I also took at swing position in ZSL (short silver) at 14.75$ as many things looked like a top in both gold and silver to me....

Sentiment as of yesterday is a bit bearish right now - so according so sentiment trader , markets should rally short term.

So right now markets is at some critical and major support trendlines and may go a bit lower to around 1300 or just above on a small gap down.

But as I told everyone I were looking for 1295-1300 and we are here now literally... 1306... close. If this is the bottom before next leg up , let it be - if not ... we go lower...

Conclusion: Plan is to sell rest of TZA 50% when I get a sell signal on daily chart so as long the trend is down and TZA is on buy signal I'm going to hold rest..... as long we go down....
But I have a fib date cycle for a bottom either it was in yesterday or sometimes today... so lets see I think a possible good buy or starter in TNA soon.

Just looking at TNA chart - lets see where I wanna buy....cause actually TNA backtested also trendline at 80.4 which would be a good buy , but daily chart still on SELL signal on TNA, but if we bounce on Friday I will get some and then get our of TZA.

Have a nice day and enjoy the weekend everyone

Thursday, July 14, 2011

Market view


Markets did a nice rally early yesterday on so called QE3 news.... I expect we will get QE3 in the future - but we wont get it before 2. August until they increase the debt ceiling - so no worries that they will be doing this right now.

Markets did just loose nearly all the gains which were made on the day at the end of the day - and closed only up around 0.3%.

If my analysis is right , we should see really panic end of this week ( Thursday and Friday ) and not sure what will come to make us panic - but time will tell us.

VIX ended in the 20's and ready to run higher with all other short ETF's imo.

Markets been flat over the last 2 days literally , usually markets bounces or rallies from MA(50) but this is weak action and I think we plunge below MA(50) and then possible 1295-1300 next. If this level is taken out , then I think we move below MA(200).

Not much to say , patience patience :-) still holding all shorts and cash in hand - I still wanna see some real panic.

If we move lower near term - I would also get a bullish MACD divergence on 60 min chart which is a good signal that a bottom is near - so if we plunge over next few days , thats a time where you maybe wanna take some profits on the shorts - but again I am waiting out until I get a buy signal on markets + sell signals on all short ETF's.

Conclusion: Still holding all my shorts , 1st target is 1295-1300 on SPX - so if we dont break below this major support - then we will possible make a "higher low" before heading higher. If we break it over next days before weekend - then my target is below MA(200) and possible 1230 , so real panic will set in.

Watch those levels.

Have a nice day

Wednesday, July 13, 2011

Market view


Markets did have a boring day on Tuesday - literally quite flat , but then plunged down into close on Irish downgrade with their ratings cut to junk (Like we saw Greece before a possible deffault)

There are a few things I wanna share - cause the markets closed right below MA(50) which could be indicated as bearish - but on the other site , markets also right at a trendline which we broke out of on the recent rally we had , so is this a backtest before we are going higher in markets?

There is also a thesis that we are making some kind of inverted HS pattern with the right shoulder forming now at 1310 and above ( needs to hold 1310 then.... ) if thats right , upside from here could be a lot higher and above 1400 - but only if 1310 is going to hold.

My main count and thesis is just still that markets should go lower - with a lot more panic to come , with the VIX spiking a lot higher from here. European markets looks pretty ugly on daily charts and is a lot lower already than US - so I think US will pick up speed to the downside and begin accelerating again.

All my 3 x short ETF looks extreme bullish to me and looks like they are about to go big soon.

As I've said before , markets is ALWAYS stretching both bulls and bears to the maximum - we rallied more than I thought and I think this time we will plunge more than I think. My short term target for the plunge is 1295-1300 , but if this level gets taken out , I'm pretty sure we see 1230 next and some real panic....

My plan is to wait until I get a buy signal on markets and sell signal on all short ETF + sell signal on the dollar before I will get out of my TZA trade. If markets tells me to do so , I need to react to it as a bottom may be in then - if we gap up today I think it might be a great shorting opportunity , as I have a fib date cycle bottom late this week where I would love to see VIX in the 20-30 and possible above 30 with real panic to set in...

EU stress test on Friday + lots of other things to come.... there might be some kind of panic to set in.

UUP did a backtest of broken trendline 21.6 and ran into close - I think the dollar should run higher near term to 22.3 or so with this expecting markets to go lower.

Time will tell whats happening , but holding all my cash + TZA still.

Have a nice day

Tuesday, July 12, 2011

Market view


Fluuuush and we got a nice reversal bar on the daily charts - all my 3 x short ETF's got on buy signal on Friday and confirmed it in a big way on Monday with more fears about Italy and EU.

The euro plunged down as called 2 weeks ago with the dollar breaking out in a massive rally , which gave pressure on stock markets and commodities.... this was called last week way before it happended. I'm still thinking we will get some more panic this week and this is not done yet! I think we just started to see some real panic - the question for me is just - how low we will go before we make a short term bottom.

Actually there is a pretty good chance the topping HS pattern plays out and target is 1130-1150 level - by September or so. But until thne we will have many short term rallies comming up, which we also is going to play as we are going to maximize profits both up and down.

Right now I'm thinking the dollar has some more upside according to the chart and therefore markets should have more downside short term.

I expect VIX to see 20-30 by Tuesday or so with some panic beginning to set in markets. The question for me , are we going to make a "lower high" before going higher or are we going to take out the lows and flush below MA(200) ? My first thesis has always been we move lower and take out MA(50) first - then MA(200) later this week and possible make a short term bottom 1230's , I have a fib cycle date at Thursday/Friday for a market bottom , so time will tell - this time I'm just gonna ride markets down until charts and stuff gives me a buy signal again.

FXE is getting close to a major 2 year trendline support - and I bet you , if this one cracks down... we are going to flush down very hard in markets and it could be very ugly. But I still have my same thesis that we will see some more panic this week and later this week where a potential short term bottom should occur (When VIX is very high again......) thats when you wanna load up on longs and TNA again.

Until now sitting with all my cash + TZA and riding them up. For Tuesday I would expect more weakness and another Terrible tuesday below MA(50) , but time will tell us. Watch out for 1300 level and if this does not hold... then I think we see 1230. So my main plan is to see if 1300 is holding - if not I think 1230 is comming... this has been my main count all the time that we should take out 1250-1260 level and move lower this week. Give me some PANIC !

I'm going with familiy to an amusement park on Tuesday - so wont be here on twitter for today , but holding all my shorts and cash TZA 34.69$ swing size position.

Have a nice day and remember - you get all these for free everyday, really hope you enjoy it.

Saturday, July 9, 2011

Market view


Markets did a sharp move down in the markets un some nasty job data - where we plunged -1.3% but ended higher over the day (as statistics said , buy the gap down on job data day and sell at close ) would make money there..

Overall I think the trend changed yesterday - I've got a BUY signal on all of my 3x short ETF's on Friday - so there is a very good chance that we changed direction. I have a bottom date late next week - so I would really love to see a hard decline sometimes next week - with some panic late on the week.

VIX looks ready to explode higher - take a look at the interesting chart from stocktiming - with the rounded bottom on VIX , very interesting indeed..... if so , VIX should spike higher soon....

The dollar UUP looks like its about to do the major breakout I have been waiting for.... to break the 1 year downtrend line as you can see on charts - with this euro should plunge hard and markets should follow with - commodities should sell off too. So the question is , if we get a hard rally in the dollar next week... Thats a critical week for either a breakout or breakdown in the dollar - but as I read it - I think we have a major breakout and bull run to come in dollar.

DUG (short oil and gas) looks like one of the most pretty inverted HS pattern - which says a big rally to come here - which means big plunge in commodities ( with a higher dollar probably???)

Time will tell - I remain long TZA and holding cash - I think this comming week should be really ugly especially late on next week. We might have a minor gap up on Monday - would not rule that out.. but after that I would expect a hard decline from Tuesday.... and over the rest of week.

When I read the VIX chart - it tells me that fear should come into markets the next week - so lets see what will trigger this...

So what is VERY interesting - now look at XLF financials.....long term view. Monthly chart we had a BULL run from march lows and tested 38.2% fib retracement from the highs in 2007. We have been moving around this level for many months - but if you look at MACD histogram - its decreasing and about to get a NEGATIVE MACD cross.....

So what does this mean on MONTHLY charts? It most likely means we are about to see a MAJOR flush in the financials this month - where it could possible test the support around 12.43-12.5 area soon based on monthly chart....

Going on a bit shorter timeframe 1 year - we also might have a giant topping HS pattern with right shoulder at 15's XLF - the head made at 17 - and right shoulder now at 15's again.... do we reverse here??

What do the HS pattern measure for downside ? It measures to 12$ .... does that say something similar to the monthly chart ? Yes a possible move to 12's in XLF which is a major move down..

It will be a VERY interesting month and could be some heavy selling pressure imo based on monthly and daily chart now. If financials start to plunge soon - then I'm the first to tell you that they could flush down hard soon...(what do we have next week ? EU BANK STRESS TEST.... uh surprise.... well nothing is for sure , we might also rally hard - but many things point to downside to come.

My plan is to hold all my TZA 34.69$ as long I have it on buy signal - for now got a buy signal on Friday and as long it stays above 31$ there is really no worries. So it might gap down small monday to 31 and then up from there - it could see 34-35 level very fast if it starts to move up - s thats what I am hoping for at least to get out break even or in some nice profits.

The topping HS pattern might still play out ... just not so sure about it anymore.. price/action next week will tell us.

Have a great weekend and enjoy.

Friday, July 8, 2011

Market view


Wow ! What a raly we have had over the past weeks.... QQQ up like 8 days in a row with about 1% in avg gain... thats really crazy and it really reminds me of the bull run we had late last year.... but the difference today is that we dont have any kind of QE now... are the big boys now trying to make people think markets can run like last year without QE ? Or will they just do this early July - before a big tank later on ?

** Updates chart with USO - potential head and shoulders pattern setting up too with target of 25$ on USO... thats a huge move down. If oil holds up here and dont move a lot higher we have a potential right shoulder setting in.**

Its really hard and as I've said before....... I dont have the CRYSTAL ball.... it came with a big surprise for me that this rally just continues and I'm sitting right now in big losses on my TZA trade from 34.69$ and holding all....

QQQ took out new highs , TRAN took out new highs - so I think my topping HS pattern is wrong - but I will still take it in my mind if we start to decline very hard from here...

So the action I will do right now is:

1. I'm really hoping of some kind of pullback - as its just really hard to believe that we will get such a big rally like last year without any kind of QE and at least a 2 or 4 day pullback after such a big rally should be expected. The thing is I hope that TZA could make a short term rally to around 34-35 and then possible get out break even on my trade - as it looks like SPX might take out new highs or get close to the previous high and then pullback befor it can take out the highs after a pullback.

But now you also understand why I said.... too much PESSIMISM in markets 2 weeks ago and why I went long TNA 68.8$ -- wow imagine if I were holding TNA still , but no one can predict the exact tops and bottoms.

I really did not think SPX would take out 1350 - were the MM's taking out the stops who did not think it could take out 1350 and then going down hard soon ?

To me UUP dollar looks pretty bullish and I still believe the dollar will breakout soon to the upside - which means markets should move down.... but last days euro has been moving down with the markets up - but most likely markets would fall down on a higher dollar.

We have bullish divergence still on 30 min and 60 min on TZA and other short ETF which means a rally is due - and we have negative divergences on SPY QQQ and others, and every single index is heavenly overbought..... long time I have seen markets this overbought - and also as I have said before - markets is ALWAYS stretching both to the bulls and bears side to make shorts cover and to make longs take a loss..... 2 weeks ago nobody really did not want to go long - today no one dare to go short..... its funny - but actually those times is often the best times to do it when you think its "crazy" to go long or short. Right now I have the feeling that it might be crazy to go short markets and other people would possible think the same, so it might be a great idea to get shorts now - but I'm already sitting in the red sea waiting for some kind of pullback.

Unemployment days usually if gap up - then sell off for the day , gap down then rally for the day.

So either way - I'm really hoping for some kind of pullback and a possible target is 1320 or 1315 if we want to run higher.

Markets looks a lot like a very BEARISH rising wedge pattern and right now we are in the end of the rising wedge which means a breakdown very soon should come. I will see how price/action in markets will do after this breakdown - if we get a -2% day , its quite strong and we might go down a lot - if we only get a -0.8% or so , then its just a little pullback where I plan to get out of my TZA trade with just a little loss or break even.

Overall I still believe we should go down over next 1 week but I have to admit this rally took me with a big surprise - so my plan is to cool off - wait out some more days and probably all next week to see if we get some kind of pullback as I can get out of my TZA break even or so.

Charts is telling me that we should breakdown and move down now - but markets just keeps going higher which reminds me a bit like late last year - but do you believe we will get such a rally without no QE ? Its possible - who knows... but I suspect it.

Remember today , a gap up would mean we likely close in red and a gap down mostly means we close green by statistics on unemployment day.

At last - I wanna share you one of my FAVOURITE indicators or tools out there which is excellent on swing trade positions and that is the Bullish percent index with an EMA(10). This gave actually a swing trade sell signal early May and have been on sell until 27th June. SPX were 1370 early May and around 27th June around 1280. Thats a big profit you would make on these signals - you could probably try them out for swing trades - and if this is reliable its still on buy signal until it moves below EMA(10). You can try it out and see how it works for you - but I find it pretty good overall - remember nothing is 100% right.

Have a nice day

Thursday, July 7, 2011

Market view


Markets did have another slowly and boring day - and been very choppy up and down.

What this reminds me as I have been saying before - after a big run in large caps - they always make the markets near flat, choppy, neutral to run the low floaters and small caps. If you have been following lots of those stocks they have all ran a lot over the past days - which reminds me, that low floaters, microcaps and small caps is the last ones they run (near a short term top - after a big run in large caps).

Bt thesis still holds true - that a right shoulder is forming in a huge topping HS pattern with right shoulder on SPX 1344-1345 area - IF we break this and move above 1350 - then I'm wrong.

I'm still holding a size position TZA 34.69 (underwater right now...) but markets really has just been creeping a bit higher slowly.... nothing aggressive.

I think today (Thursday will be key day.. either we go big today or we start to sell off....) we have some key data today + tomorrow. We might see a pop fast to 1344-1345 to form right shoulder - but I'm a bit worried right now with TZA as its already a lot lower - so Russels needs to hold here and stop moving higher. But I'm watching SPX for the topping HS pattern with the right shoulder target at around 1344-1345 if we reach there today...

Like I said - sentiment is very much changed now and what I hear many places is new highs to come and so....

AAPL did a potential backtest too of long term trendline - called kiss of death ( if this is true should fall hard down soon)

Look at Russels chart - pretty nice backtest of trendlne made... and 30 min chart shows VERY tight and BEARISH rising wedge pattern.... up to trendline.... 30 min chart showing bearish divergence too - all is in place for a hard landing...
Euro has been moving down and dollar has been moving up nicely last days as I have been predicting. If its right the dollar is about th have a MAJOR move to the upside soon - which (most likely would mean downside in markets..)

I was a bit too early in my entry TZA - but its hard to predict the EXACT top - and over the last 3 months I have pretty much nailed the moves up and down. But overall still believe we are heading down hard over next week - so time will tell us today.

Agree with some comments - that markets extreme overbought and quite bullish they manage to hold us up...

Looking at TLT looks like tested support and ready for last leg higher up.... if this is true - markets should fall down (possible cup and handle in TLT)

Looking at other 3 x short ETF like ERY one PRETTY inverted HS pattern - gives me more confirmation that we are about to go down hard. ERY gave a buy signal yesterday on daily chart at 13.97$ with neckline at 18 and a move to 23-24$ could come on that pattern.

Try look at the DUG chart too - impressive and very nice inverted HS pattern on daily chart too with buy signal yesterday too , so looks like a MASSIVE flush in markets is about to start - and a big run in those 3x short ETF (Based on this HS pattern....)

Conclusion: I'm still holding all TZA and cash , what I will be watching is SPX if we breach above 1344-1345 (left shoulder and should be the right shoulder) - if we rally above there and to 1350 I'm wrong , but until then still extreme bearish at the moment. Dollar looks like about to have a major breakout with euro going down hard. ECB meeting today....

VIX daily chart is on buy signal - DUG and ERY looks like pretty inverted HS patterns - China already started to move down with Europe a bit - US should follow soon. We will have some nice action in markets end of this week Thursday and Friday.

11th July they need a long term plan for Greece - will they manage to get a good one ? Or will it result in deffault ? Portugal need 2nd bailout and maybe Ireland too - when will they stop giving money to a black hole ? Time will tell what will happends

Wednesday, July 6, 2011

Market view


Markets did have a pretty boring day - opening flat - and closing quite flat. No economic data were out so no "triggers" to either rally or plunge.

As more we come into this week we get more and more economic data. Thursday and Friday this week we have a lot of economic data and therefore expect some big markets movements.

What was really interesting was the change Monday on the euro and the dollar. The euro got a sell signal yesterday on daily chart with the dollar getting a buy signal.

Euro ended quite oversold short term so a possible bounce Tuesday could happend. But overall I am looking for some nasty downside in the euro and a big breakout in the dollar to come.

Still holding my SIZE position TZA 34.69 for a swing play and cash.

My view is still a MAJOR topping HS pattern to play out - as long we hold SPX below 1346-1350 then we could form a right shoulder on the daily charts. Target for the pattern is 1120-1150 area IF we break below 1250 area.

What was interesting was the VIX gave us a BUY signal too - with a move higher and higher low than Friday. So fear is moving into markets again.... which is good for bears.

Conclusion:

All in all - markets is still extreme overbought short term - take a look at my QQQ chart - literally NO support below after this runup with no pullback or consolidation - means not much support below too.... and if we dont break below 1250 over next weeks - then I would at least expect at 20-40 point pullback - so either way , watch out below... we get more and more economic data late this week + 11th July they need a long term plan for Greece (next week). I'm not sure they can make a good deal... so lets see what to come next days and weeks. Sentiment as you can see is EXTREME optimism in the short term - which mostly means downside risk to come short term...so for now - short the pops if we get some and stay cash.

Have a nice day