Tuesday, November 30, 2010

Market view


Well yesterday we got gapped down as I said that the 30 min and 60 min indicated a bit lower next day before a major move up. I still believe this scenario and think that we are about to breakout to 1210 this time. 30 min and 60min now indicating that markets should most likely start with a nice rally today and probably continue. But looks like we could reach 1200+ or 1206 today before a little pullback and then higher to 1210-1215.

But take in mind though, that my weekly charts still indicate that the markets should head down, but markets been so strong and consolidating, especially IWM(small caps) , which is near highs.

There is a potential HS pattern in markets and I believe it could play out, but before that 1210 to lock in rest bulls before a slam down. 7th December is bank runaway, could be something near that date to start a sell off with potential more news from Korea, Spain, Portugal....

But all in all, when we come to 1210-1215 area I am going to watch closely, cause I am thinking of a big fat move down, but if I am wrong and we move past 1228 - then we are on our way to 1250 and probably 1300.

So all in all - looking for breakout higher over next few days before a big move down. I think the USD needs to pullback for a week or so, and you could nicely trade eur/usd going long for some time near term imo.

But lets see have a nice day

Saturday, November 27, 2010

Market view


Well we got a half day on Friday with stocks down a little. Looks like we did not get the little move up as expected, but then got down to 1187 pivot support area as I expected we should go before a move to 1210 area.

Well I think we could see the nice move early next week. Remember on Monday we have a DOUBLE POMO day...... so guess we wont go low on monday. I still think we are setting up for a wave 2 up to 1210-1215 area before the ugly wave 3 down.. And for me looks like wave 3 down will start with Spain and some war in Asia as a trigger for sell off.

I got in some small caps longs "CMM" and "SNSS" friday, cause I think they are going to run small caps early next week. What I see in the IWM is that small caps are about to get a bullish MACD cross from negative to positive which usually gives good pops in markets. But again, this line could be rejected and turn back and stay negative, but with POMO in works monday with double up it will be hard.

We made a big move down last seconds in markets and is it because they should form a little inverse HS pattern ? We dont know, but possible..

If we look at the 30 min it tells me we might have a gap down on monday , because my 30 min chart tells me we still have more downside before turning up.

Overall we should make a big HS pattern in markets.

Overall I stay a bit bullish for early next week, but after that very bearish. Watch the 1200 resistance and then 1173 low. What I hope is a nice pump in markets with double POMO program, monday tuesday and then hard down to 1130-1150 SPX.

Have a nice weekend

Thursday, November 25, 2010

Market view


Happy Thanksgiving all

Today (Thursday) is holiday and markets closed. On Friday remember we have only a light half trading day.

With that said I dont expect markets to get any big moves to the upside, nor the downside on Friday, so lets take a look at the markets.

I got long BWEN and CNXT Wednesday morning and already in profits, but both are about to breakout and small caps usually go up on light trading volume trading days.

I must admit that the daily chart is about to give me another buy signal (but I just dont really believe after a thanksgiving week (which has been bullish) ) that the markets will move to new highs.

This is currently my plan and what I am expecting.

With the 30min chart and 60 min chart already overextended and overbought I most likely expect a "gap up" and then hold around there before moving slowly down over the day on Friday. The area in SPX is around 1200-1207 (Where I am going to short markets) cause we should at least get a pullback on monday. How long the pullback will be should be near a pivot support 1187-1191 area before last move up to 1215 area where we have a potential head and shoulders pattern with right shoulder in.(Sloping).

So I believe we will make a "lower high" than last 1227 and then begin our big wave 3 down. But time will tell and lets try look at it everyday and see whats happening. Enjoy !

Tuesday, November 23, 2010

Market view


t

Well just a quick update after markets here...

Overall it was a BRILLIANT day if you are short and long the dollar. Wow...the dollar exploding higher as I expected and been long the dollar for the last weeks now.

Looking at it all, I see a perfect HS pattern in the markets and in the Gold where we made the right shoulder today in gold. When gold is moving down the dollar will most likely move up and breakout.

As I told before I think the dollar will break above 80 and rally further. Everything in line for a nice breakout in the dollar and plunge in the euro. But the euro FXE is right now at CRITICAL area support. A breakdown below here is VERY bearish the euro and that indicates that much more selling ahead. I think the euro will breakdown and the dollar will continue rally short term. I see the SPX near 1130-1150 at least before any big rallies, so for now still long the dollar and short the markets. Looks like gold made a major top and should see a nice decline at least to 1.180 area before any big moves higher. It was an overcrowded trade the gold and needs to go down a bit.

Overall will be VERY interesting tomorrow imo, cause will the euro hold good big support here ? (look FXE reversed direct from MACD trendline as spotted weeks ago) Will the dollar breakout higher ? 30 min chart and 60 min chart VERY oversold in markets now indicating a good day to buy the dip (But remember when we are down here thats when the biggest extreme moves will happend - so might still be oversold.....)

All in all best of luck I think we are about to see a nice breakout in the dollar and heavy selling in markets to begin.

Have fun everyone

Market view

qu

Another slowly and boring day.

I still believe that the dollar will breakout to the upside from the 78 support and the markets is going to tank further. Thats why I am holding my shorts via TZA and think it will happend this week.

As I am writing Asia is down -2% and near -3% overnight and looks like the HS pattern is about to play out. I got some news about Korea and a World War III as I have pointed out 1 month back that it might happend soon. This could be the trigger of World War III to begin as normal war, but in next years biochemical and nuclear should also be included.

Well but again to markets - my weekly chart on the dollar and euro suggest that the euro is going to tank hard this week and the dollar should spike up hard most likely. Well no one has the crystal ball but thats just how I read it now. But I have some longs if I'm very wrong and I got into a new play called AEZS at 1.36 and SNSS 0.34 and EONC 2.3.

Lets see how these plays will play out next days.

I still believe we have more downside and could easy see 1150 this week and maybe 1130's.

The HS pattern I made a quick chart on it and its possible we see it play out over next days. Today we have GDP numbers in US ane Europe, so lets watch what the US dollar will do and then the dollar should tell you direction. If dollar breaks out of 80 this week as I am calling - well then you going to see some heavy selling begin I'm sure....I think people will seek into USD now as war is likely to begin..........and it can be AGGRESSIVE buying in dollars..(Kim Jong II long US dollar ? lol )

But time will tell have a nice day

Sunday, November 21, 2010

Market view


Well markets in US been down overall for last 2 weeks, with a little upside late this week. I think the little rally we had late this week was an OPEX bullish week with an oversold bounce (Cause we were very oversold with markets down 7-8 days in a row..) so lets see I am expecting continued weakness in markets over next week and looking for 1155 as first SPX target and then 1130's area.

Lets take a look at some interesting charts.

VIX about to breakout of a falling wedge on the 15 min chart and ready to go higher early next week(Monday tomorrow).

VIX 30 min chart got the same option , a bullish falling wedge ready to breakout to the upside monday morning.

The dollar UUP is still above its broken resistance and finding support in this area. Its normal for the dollar to get a little healthy pullback (we had 2 days) after a 9 days runup.

I'm still very bullish the dollar and very bearish the euro near term and I can easy see a really ugly week cause we are getting the bearish stochastics crossover on weekly chart EURO and bullish crossover in the dollar UUP.

So overall if you look at my FXE and UUP chart you can clearly see that this week is a potential very BAD week for markets and VERY bullish for stocks as we are about to get a simple BUY signal on the weekly chart this week. But we need to get that confirmed this week and not go mumch higher from here(Maximum 1207 or so SPX).

Time will tell, but I'm holding my shorts tight and still long the dollar.

Still long KAZ and got some ELTK earnings play monday (1.35)

Have a nice weekend

Friday, November 19, 2010

Market view


Well yesterday we had a really nice rally, but take in mind it was GM IPO day and still OPEX week, so lots of volatility. What I see now is, that the markets is make a nice clear HS pattern, where we are about to form right shoulder before a nasty move down, and that would take us to 1130 area.

I dont think we bottomed out yet and still think we have 1-2 weeks more downside left in markets, so no reason for me to cover shorts.

I did go long one stock KAZ, which I think is very cheap and a nice breakout chart. They had some great news and KAZ is a very undervalued stock by fundamentals. Target 1.5+ short term.


Overall by the indexes many of the is staying below their resistance from highs, many indexes already have backtested their broken trendline and its called the kiss of death, cause a big move to the downside should come after that kiss.

The dollar had a little pullback to support and I think the dollar is ready to rip higher near term.

So overall still long the dollar and short the markets. (Long KAZ but have a watch on CRBC too, small bank CACB went up huge...CRBC looks ready but risky play)

Have a nice day and enjoy the weekend!

Thursday, November 18, 2010

Market view


Well a slowly day yesterday and thought that the bulls would push the markets up stronger than this little weak push after a big sell off...

Overall I think markets is going to touch the SPX 1187 near term, possible with a gap up with GM IPO today, lock in lots of fucked retailers and then flush it down. I think GM will have a good run when opening, but will go down after locking in most retailers. About the markets I think we will gap up most likely and then reverse hard down and we are going to see SPX 1155's near term.

My put/call ratio ALL indicates that some big boys out there are very bullish the dollar and very bearish the markets still, so that indicates more downside near term. We may get a little contra trend pop to our downtrend line, and that would fit with the VIX which broke out of huge falling wedge, making a backtest of broken trendline and the dollar making a backtest this morning with broken trendline and then rally hard off here. IF and only IF we get a gap up to near 1187 area I would use it to short as much as I can for the short term.

The weekly chart in the dollar and weekly chart in the VIX is still extreme bullish to me and should get a nice pop up near term. I think we will see 1155's area pretty soon, maybe tomorrow morning.

So yes, today welcome GM IPO... lock in those retailers money and get them...I will never ever buy a government security like Freddie Mac and Fannie May...

But all in all - the dollar looking for a backtest and then rally hard with the VIX a backtest and rally hard. TZA put/call ratio extreme bullish on TZA, so we might see TZA form right shoulder in a inverse HS pattern to around 21.5 level (support) today and then rally big from there and up to 24's tomorrow.

Also many indexes looks like we have put in a classic HS pattern with the head the highs and about to form right shoulder(but if we are going to form right shoulder it would look more pretty with a little move up today to form it - around 1187ish..)

I'm still long and strong TZA 19.4 major position and added some yesterday 21.6's. Will try to add more if we gap up today in markets. Still long the dollar too..

Have a nice day

Tuesday, November 16, 2010

Market view


Well today I will just make a quick update after market close, will try to add some more charts and comments tomorrow.

As predicted yesterday TZA got a huge move to the upside with the dollar moving up too. I'm still very long TZA and the dollar.

When markets was 1228 I made a topic and called it a major top with 61.8% fib retracement, optimism extreme highs and every shorts I knew of began to cover. The USD flushed below support but regained quickly, thats a PERFECT signal for a blow off top. TZA was near 19.4 at that time, glad I got some of it.

Still holding major short positions and the put/call ratio readings telling me that the DOLLAR is EXTREME bullish and about to go higher near term with the markets especially China (FXI , extreme bearish and Semiconductors). So I expect the markets to move lower near term and most likely into end of November still.

The VIX broke out of a huge falling wedge which is a VERY bearish sign for markets and VERY bullish the markets telling me a big move to the downside is comming in markets and big move to upside in VIX. The same with the dollar, today was the FIRST DAY the dollar had above HUGE weekly downtrend line , but today we killed it and got above with volume ! The dollar had 2% bulls 2 weeks ago and so much fuel now to make the dollar run a lot higher. The Weekly chart FXE looks VERY bearish to me and I can easy see it go to 1.33 near term, maybe a little bounce from there but can also see it crush below sometimes next week. But all in all , lets take 1 day by 1 and see it from there. IF and only IF we get more upside here my target would most likely be 1194-1197 are to fill the gap we made, another good fib target is 1187 which is a pivot point and acting as resistance now.

I'm still short markets via TZA and long dollar overnight.

Adios!

Market view


Well well - today is going to be a very interesting day as I think we could have a terrible tuesday. I am still long TZA and still long the dollar and I think TZA is the one to be in short term. I made a chart and I can really see TZA break above huge resistance at 21 now and then a BIG move to the upside will come.(Most likely today)

The VIX chart also about to make the huge breakout above 21 (same number?? lol ). VIX weekly chart is coiled and ready to blast and the daily chart seems also ready to make the break.

The top we had here reminds me a lot of the top we had in 2007 and who knows? I really dont think we are going to make any new highs , but we will see much lower prices in the future. I think people who are shorting this markets now will be very rich in 1-2 years. But overall I must stick to my indicators and charts for the short term and at the moment they are telling me to short, short short. The most bearish reading according to put/call ratio is IWM = small caps. I got TZA cause thats 3 x BEAR IWM(Fantastic?) so TZA should make a huge move to the upside today.

The euro FXE flushed below MA(50) and will continue, weekly chart looks ugly still.

Well overall - look for a big move to the downside and keep your shorts tight with TZA and long dollar.

There will be a time to go long the markets and long the euro again - but time is not in yet.

Have a nice day

Saturday, November 13, 2010

Market view


Wow what a week! We had a big POMO day Friday and rest of the month, but didnt rally big today. We have actually had lots of POMO days now where we didnt rally. So if everyone think markets moving up with POMO and it wont move up, everyone will be scared and sell because they think all POMO days is up. Well first of all my short term target was 1196 area and we got there.

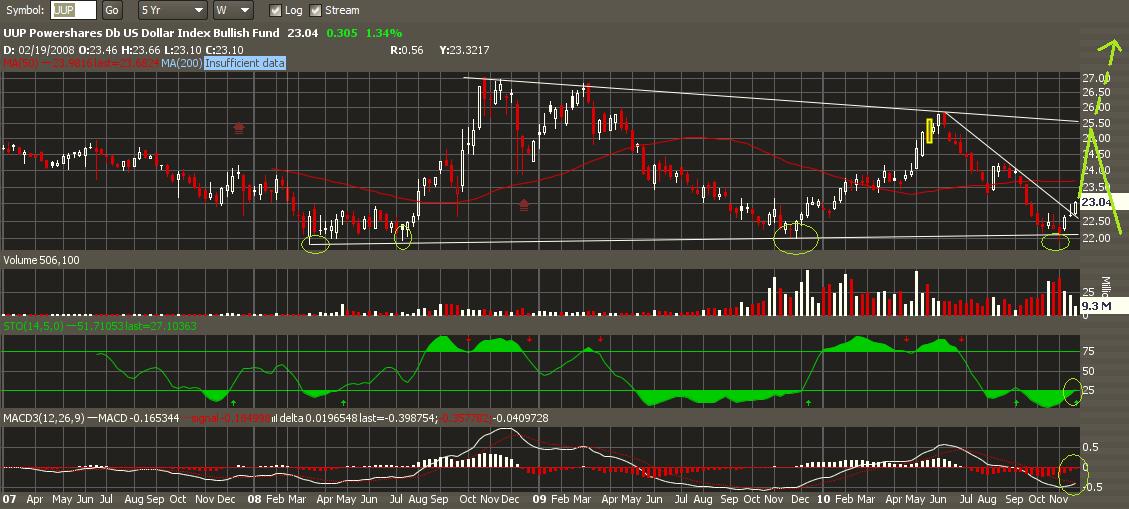
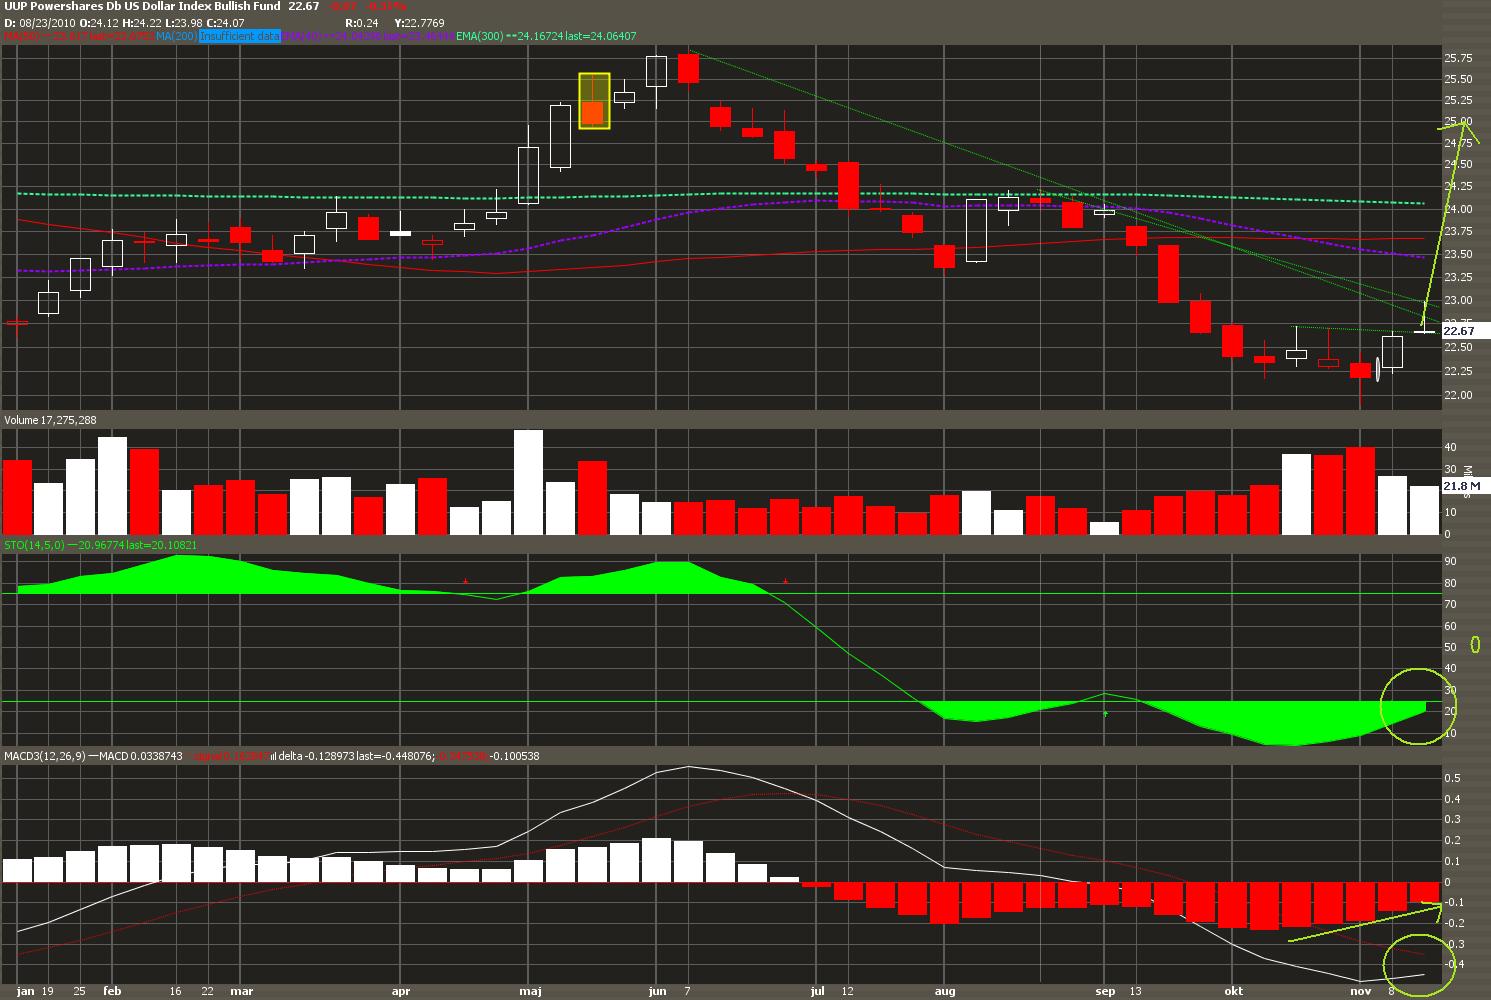
If you are bullish this markets this area on Friday was your "buying opportunity" before last rally up to new highs.... So lets see what next week brings us. Remember I told you days ago that FXI, EEM and other indexes got the most bearish readings put/call ratio and until now Shanghai was down -5%! Well I still think we are heading lower, the weekly dollar chart looks bullish and the weekly euro chart looks very bearish.

I also posted that the NASDAQ backtested its broken trendline and that it was a kiss of death before a plunge ( and Friday we saw a nice plunge in the markets .. ) also the MACD got a bearish signal on the histogram and went negative.

VIX is still in its huuuge bullish falling wedge and is "knocking" on the upper trendline now and increased over 10% indicating that fear is comming back to markets.

Well so what do I think at the moment ? Do we get our last rally to 1250 in SPX and higher over next weeks with huge POMO days everyday ? Or de we just plunge and screw everyone ?

Bullish sentiment is the highest in the whole year and with insider sell/buy ratio at extremes and never been so high I must say that I think we are heading WAAY lower....I think the selling pressure is just beginning here and we wont make new highs, but make lower highs from here and lower lows.

Fridays readings for the PUT/CALL ratios the most BEARISH readings was EEM, SMH and XLE which is Emering markets, Semiconductors and Energy sector.

This tells me and indicates that there is more downside to come short term in these markets and we hare heading LOWER. My weekly chart for the dollar is VERY bullish and weekly chart for FXE is very bearish.

Lets see if China make increase their interest rate should make the markets sell off a lot more. Monday will be critical and if we break the falling wedge monday it looks very good for the bears and VERY bad for the bulls. So monday need to be an UP day for the bulls to be in charge still if not the bears are in control.

VIX weekly chart also look very bullish here imo and I can see the VIX rise for the next weeks to come. Its coiled to breakout of this falling wedge....

Isn't it ironic that every time the market tanks it is never our fault? Today we blame China, in May it was Europe but it never seems to be the US that is to blame for anything. If we lose jobs, blame China. don't blame the US companies who moved the jobs or the unions, environmentalists or high taxes, no blame China.

If the dollar goes down we blame China too calling them currency manipulators. Really? Their currency is pegged to a basket and they have strong growth. Was the US manipulating the dollar when our economy was strong? The dollar is falling for a very good reason, we are printing dollars like mad. Our government issues massive debt and the Fed is monetizing debt and all the mistakes Wall Street made.

Guess why we need QE2. It is because we can't sell all the debt we issue, who wants to buy US bonds that yield next to nothing and the currency declines daily. Do you want a 2 year note that yields .5% if you are lucky while the dollar went down 8% in a month? What idiot nation would buy them? What we had today was a sell off in stocks to drive people in to the "safety" of bonds. It was well planned being that the Fed was buying today as well. There is a huge bubble in bonds and the banks who borrowed for 0% from the Fed to buy them are stuck with trillions worth of bonds for which there are no buyers. The Fed is doing QE2 to cash out the banks before the bond bubble implodes.

The G20 told the US to go home, our problems are self created. Stop spending, stop bailing everyone out and stop printing money. Go grow your economy! Free trade has worked out well for Asia, not so good for the US. Once we opened our borders to unlimited imports, we killed our own economy. Corporations will go where ever the labor and taxes are the least.

Now maybe, just maybe, all the selling today was because the market went up for 9 weeks on the announcement of QE2, today it finally began and traders are selling the news. The market shot up, this is profit taking. Wall Street managed to sucker fresh retail money in, now they are doing what they do best, steal it.

We don't need to have a reason for everything or someone to blame, all we need to do is look at how we are running things here and to always remember that Wall Street is out to rape you blind. They aren't here to make you money, they are here to make money for themselves, up or down.

Still bullish the dollar and bearish the markets.

Have a nice weekend and enjoy life !

Friday, November 12, 2010

Market view


Well well - as called the QQQQ had a bearish MACD cross yesterday monday and plunged yesterday. SP500 and DOW holding pretty good but should get bearish MACD cross today(Friday) which should make them plunge big today.

First of all according to the put/call ratio which gave me a buy signal in TZA at 19.4 on Friday and yesterday the most bullish readings were "UUP" which is the dollar and which indicates that the dollar have more upside near term. The most BEARISH readings was EEM(Emering markets)FXI (China) and FXE(The Euro) which indicates that these ones have more downside left.

Right now when I am writing the Shanghai is down -5% overnight (Surprise!?!?...) this is the start of a big correction/crash I think and there will come a lot more. All the GDP data from EU was really bad and ugly.......

Think about it Germany the most important in EU was revised from last 2.3% growth, expected 0.8% and came at 0.7% !! So thats a big drop from 2.3% to 0.7%....(Yeah bullish if we had QEII)

Now G20 came to a deal that they wont devalute their currencies so lets see if the dollar wont be able to rally on this now with all this EU crisis here.

Well lets talk about the technicals, the dollar UUP broke recent resistance at 22.62 and holded above it and sitting near its trendline from the lows. So if its holding the dollar should bounce higher from here and the euro should go down.

What I found really interesting yesterday was the FXE(Euro) weekly chart which had been traind in the range of the MACD trendline (bearish) and is making a bearish engulfing on the weekly chart - with the dollar making a bullish engulfing on the weekly chart. That tells me that the dollar has a lot more upside to come over next weeks and the euro have more weakness. (which indicates markets dropping and my shorts rally - look at the FXE chart yesterday)

As I posted the charts with CSCO and market top I actually think that the top is in and we wont see this top again in the next 7-8 years or so.

The AAI sentiment is at HIGHEST level in 2010 and have not been this high before(So many bulls at the moment and overcrowded). The insider sell/buy ratio is at EXTREME and last week was the highest reading ever over the last 100 years ! Think about that.....if we are out of recession and if everything is good...why the heck do all the insiders from the persons who are RUNNING the country sell everything..... Dont be stupid... the COT (smart guys) are short these markets and the dump money is (long markets now) according to the COT report.

NASDAQ broke yesterday below the trendline and made a clear backtest of brokentrendline. (Kiss of death) which means an ugly move should come to the downside now.(Well China -5% tonight) so lets see today.

I got my last TZA last friday at 19.4 and but overall I'm down on my shorts but I think I can fast get in profits with some patience here.

Looking at the VIX chart its a in huge falling wedge and I can easy see a breakout of this falling wedge which should indicate huge selling in markets. (VIX above 20-21) would indicate break above trendline

All in all - staying short and holding. Lets see our first short term target today is 1196 SPX but if we break that I think we can see 1170 today especially if we follow China market down.

Have a great day (Long the dollar, short the markets)

Thursday, November 11, 2010

Market view


Yesterday we got some more selling and then some dip buyers pushing the markets higher and recovered the day. I think the trend has changed and we need to see a fat sell from here.

The NASI needs a RED day and not green - if we get a green day today we could have a buy signal on the NASI which should not occur in this territory.

I expect a big fat red day today below 1200 SPX and the dollar rally again from little pullback..

Well time will tell the only thing is at least when SPX is below 1220 looks like we make a lower high and lower lows for now.

Im just making a quick update with the charts.

QQQQ is getting so close to loose the long term support trendline here, but snapped back up. Lets see if we manage a CLOSE today below this trendline which would be ugly.

G20 today and tomorrow... lets see if anything happends here..

Expecting the dollar to rally further.

The NASI needs a lower low today(red close) - my target for today is 1196-1200 area...and lower to come

Some interesting chart by humblestudent on the top.

The CRB index reached the top of a huge channel down and reversed ( down -0.5% today ) and there is a lot more downside to go now.(Daneric chart)

New update : Take a look at the euro chart (weekly) what I found out VERY interesting is a big huge bearish divergence and we are rolling over RIGHT at the time making a BEARISH engulfing pattern on the weekly chart. Very bearish for the markets and I think there is a lot more downside in the euro to come. Look at the MACD histogram the green line I made.


Have a nice day

Wednesday, November 10, 2010

Market view


Finally we saw some heavy selling , especially if you look at IYR(Real Estate), GLD(Gold) and Silver(SLV). Big selling pressure with huge volume, mostly marks a top. The dollar also rallied nicely and the chart looks ready to go.

What I find interesting is that yesterdays most bullish ETF/Stock was UUP according to put/call ratio, so someone believes that the dollar are going to rally near term which I agree a lot on.

Today we should get a new POMO release - someone knows something before us about it?? Why is the dollar rallying suddendly? G20 meetings this week and some GDP numbers out late this week from europe.

Well all in all - the indicators at least telling me we should go down until near end of November, how much we really dont know. But I think 1170 or 1130 area is the areas to watch if we confirm our move down next days and the trend has reversed.

I believe the markets is very close to roll over here and a nice decline should. The NASI tells us that markets is getting very close for some bloddy redness so lets see, yesterday was a start.

IF and only IF we just get a pullback before higher it could look like this area so on SPX should be 1130 or 1170 area. Everything else telling me we go down over next weeks.

The QQQQ if this index loose its big support since September lows, that could be VERY ugly and go really fast. Huge bearish rising wedge.

After I stated friday that TZA got the most bullish put/call ratios out there , now we know why someone opened so many calls in TZA. Already up a lot since then and there is a lot more to come next weeks.

Stay tuned

Have a nice day

Tuesday, November 9, 2010

Market view

Well Euro/Dollar has been declining and the dollar reversed. G20 meetings comming up soon.

The CRB index is very near a huge resistance in a huge channel down pattern.
http://1.bp.blogspot.com/_TwUS3GyHKsQ/TNiPg2hACRI/AAAAAAAAIBw/lxmKF_RxxLY/s1600/crb.png

The sentiment on the NASDAQ is still very high and the RSI(14) on the daily chart is above 80. Thats unsuistainabe and wont last, at least not regarding to the history which havent been above 80 RSI(14) more than very few days and after that usually a big decline. Question is now - do we get a pullback before higher or do we get a crash move down? What I like to see is there is a lot more concerns about EU debt crisis again , now QEII news is priced in. Also there could happend some dangerous things, terrorism is heating up around the world. ABK filling for bankruptcy and lots of the financial institutions are bankrupt. But again we should just look at what the price is telling us.

Here is a chart by Daneric, which is the short term bullish count.
http://1.bp.blogspot.com/_TwUS3GyHKsQ/TNhuLF-LHeI/AAAAAAAAIBo/n9Z82--8PVM/s1600/indu.png
This shows that if we wont accelerate to the downside soon, we could most likely pullback before going higher in wave 5 up.

Again its hard to say and elliott wave dosent work without simple technical indicators. We could also be looking for start of wave 3 down now and wave 2 is finnished. The NASI is still on sell signal which indicate no matter what there is a very good chance that over next 1-4 weeks markets should fall.

Here is a chart of Russel by ETF Corner
http://www.etf-corner.com/.a/6a010535da87f8970c0133f5acd61e970b-pi

This chart looks good and IWM are near big resistance here. I expect huge decline from around this level. TZA = 3 x bear IWM.. so thats a good choice to go with. I'm already in a lot and stuck, but can be patience and wait the sharp sell off out. So IWM around 73-75 level is a huge resistance and should hold this rally. Until now its stoppped moving up.

Also insiders selling still like never before and COT smart traders are short markets. I dont trust the markets and think we are about to see a nice crash (still). I have been way too early, but again would you like to buy here ? No way also when Euro debt crisis is beginning again could make the euro fall huge and the dollar take off...

The SPY is still at 61.8% fib retracement and should sell off from this level. Thanks to ETF corner with chart.
http://www.etf-corner.com/.a/6a010535da87f8970c013488cec5b1970c-pi

All in all lets see what today brings. Might be a gap down and rally to 1232-1237 area and then we get our crash or we just crash from here.

Have a nice day